The database isn’t the hard part: starting a data program at your agency
Why it should start with revenue, the steps to get there, and why an automated, shared revenue report matters.
After a recent talk, a VP of operations from another agency asked my opinion on his team’s plan: feed their new CRM, ERP and scheduling software into one database, then layer reporting and AI on top. His theory was that building the database would be the hard part.
But actually, the hard parts are all the things surrounding the tech. Where do you start from? Politically, how do you align interests? Where are you headed and why?
Each one of these is itself a major question. For this post, I want to start with revenue: why it comes first, the steps to get there and what you end up with. Capacity, utilization and, most importantly, margin will come in later posts.
This is written for the CFO, COO or head of operations at an agency or any professional services firm. Use it as you get your own data program up and running.
Start with revenue
You and your CEO will want to include everything. Don’t. For agencies, revenue is the natural starting point. Why?
- Revenue can be transparent: you’re more likely to share revenue numbers throughout a company before cost (esp. salary).
- Revenue is yours to structure: you control your own contract and billing model for customers. Your vendors likely bill you in the ways that suit them.
- Alignment is (more) likely: everyone on your team is likely pulling in the same direction (“let’s make more money”). Whereas costs (or the components of costs) can sometimes advantage certain groups over others.
- Revenue is attributable: a dollar from Customer X relates to one contract in a true 1-to-1 way. Whereas you’re more likely to want to split costs in different ways across groups (ex: software across departments, a role that’s shared between two teams). That’s inherently less stable than “a dollar from Customer X is for Project X.”
From this, the kinds of questions you might ask become clearer:
- Where did we end last month, where do we expect to end this quarter?
- How does our revenue, both signed and in the pipeline, compare to our goals?
- What changed since last week and which deals or projects moved?
Crucially, when we say “we will make $1M next month,” we want full attribution for every dollar of that $1M. Each one should be associated with a certain contract which connects to a client (and ideally a distinct project) that allows us to connect to other metrics.
The steps to get there
The challenge is to bring together two systems here: the ERP (Sage, QuickBooks, etc.), which contains the historical information, and your CRM (HubSpot, Salesforce), with information on future opportunities.
Your team might already do this, but in a mix of Google Sheets or Excel files to (manually) bridge those gaps. I’ve seen entire roles dedicated to maintaining these fragile schedules — requiring a human to run an elaborate downloading of CSVs and gather soft context through meetings, Slacks and familiarity with the contracts.
This is the first area for automation. Unifying these two systems takes custom code and clear definitions of process and terms. From it, a reliable picture of your revenue serves as a basis for all the work to come.
To begin, your team will build data pipelines that extract data from source systems (CRM, ERP or even custom Google Sheets), load them into a central database (Google BigQuery, Microsoft Fabric) and transform them into company-owned structure or schema. It’s this top-level, fully cleaned data that’s so valuable (companies often call these ‘gold’ tables).
This transformation is key. It’s where the business applies its unique decisions and rules. The person who’s been maintaining the manual workflow is instrumental in codifying that into an automated process. What are the rules? The exceptions? How do we know there’s an exception? What data do we need? What’s just nice to have?
To join between recognized/historical data (ERP) and prospective/future data (CRM), you’ll discover the power of ID numbers. Having a random number to identify each data item (a deal, a client, a project…) might feel unnecessary, but it actually frees people from the naming requirements that are hard to enforce and generally fail over time.
As you start, have your data expert turn on daily snapshotting of those gold tables. This is a low-cost thing to start doing on day one. You can’t report on historical trends or comparisons if you don’t keep your historical data.
The output
The result of these steps brings you to the first major milestone: a reliable and consistent revenue report. Every time a deal moves forward (or backward), you can see the exact impact on your year-end numbers. With common identifiers, you can automatically track the remaining open amount within a particular customer or project. With historical data, you can compare where you are today versus last week.
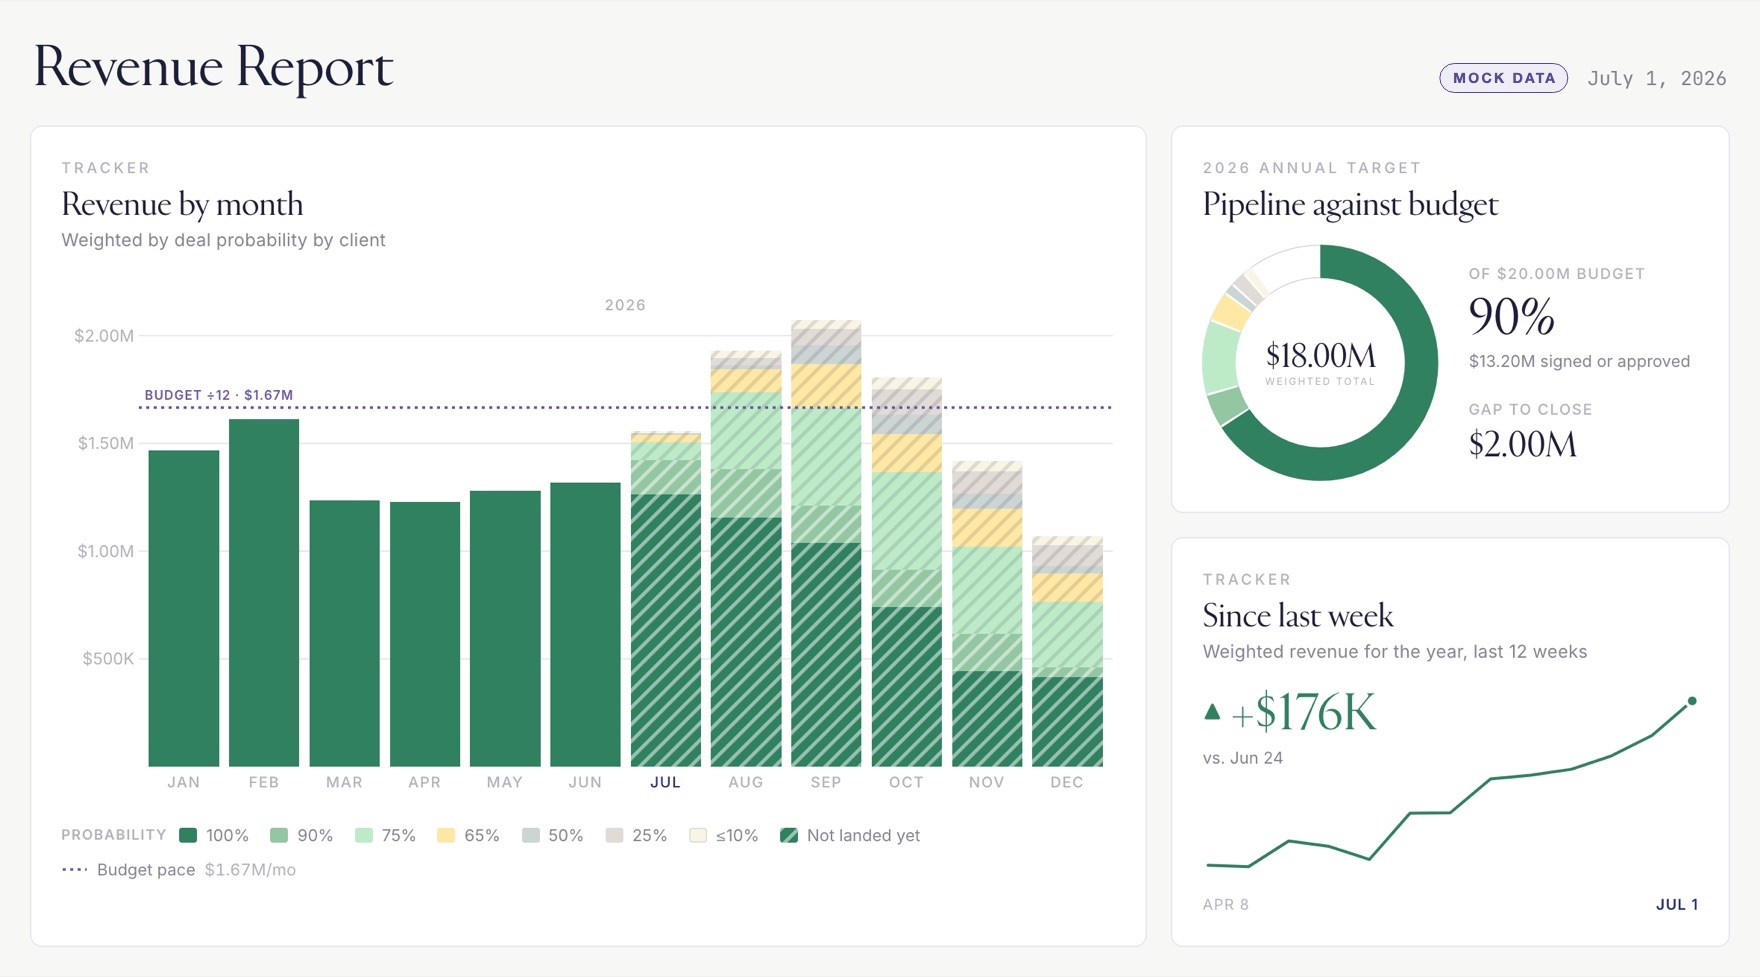
Once automated, the cost of producing this report is trivial. Pennies. Run it once a week, once a day, even once an hour. When you can take what used to be a human exercise and make it all but instant and free, you’ll find your creativity opens up to ask more interesting questions and communicate to more members of your organization the details they need to know.
This is the human win from all these computer-based efforts. I found my human time went from juggling spreadsheets to thinking strategically about how I could share important data and information across the team and with certain individuals. Who needs to know what? What are the relevant comparison points? How do you attach accountability?
The signal
Consider the organizational signal this type of report provides. When the whole team rows in the same direction, you can achieve remarkable results. That requires an accurate picture of where you are. Few organizations have this; fewer share it beyond leadership.
“What’s going on” shouldn’t be a secret. Yet, it’s a major complaint I’ve heard over the years across our team. Understanding the state and health of the business is important for employees to contribute. I heard from a team member once how they were on the fence about suggesting a new workstream to a client, but knowing we were a bit behind goal for Q3 nudged them to do it. That became an important project last year.
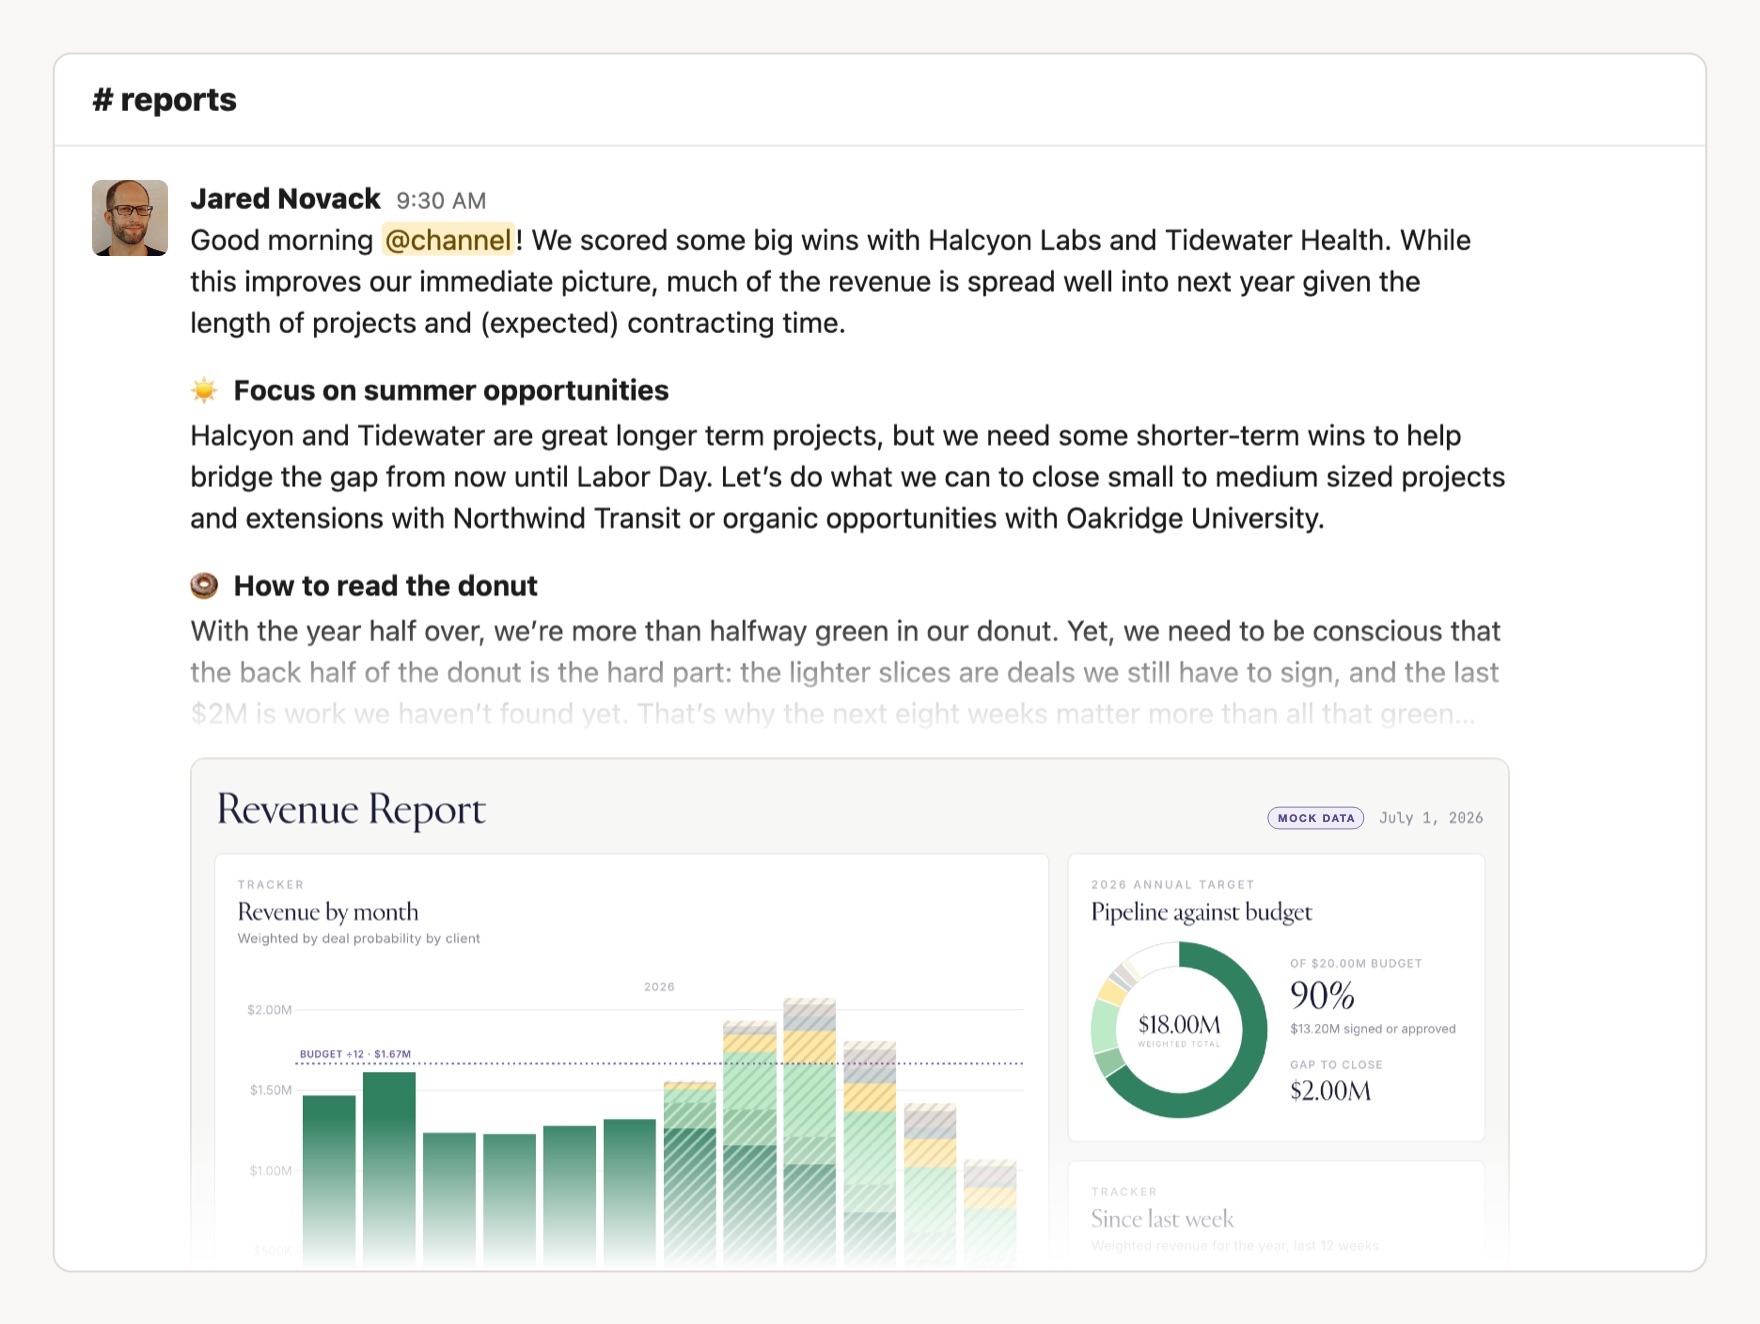
From here, we can use many of the same techniques to bring in data on your people: who they are, what they’re working on, etc., to create a corresponding picture of capacity and utilization. That’s coming.
Back to that VP’s theory. Bringing this into a database is necessary, but getting it to the right audiences, with the required understanding, at the proper cadence is the hard part.
Newsletter
Capacity, utilization and margin come next. I send new essays on data, software, and the business underneath them — occasionally, no spam.